What Are Football Win Probability Models?
Football win probability models are sophisticated mathematical systems that calculate the likelihood of match outcomes by analysing hundreds of data points. These models have revolutionised how we understand the beautiful game, moving beyond simple predictions to provide precise probability estimates for every fixture.
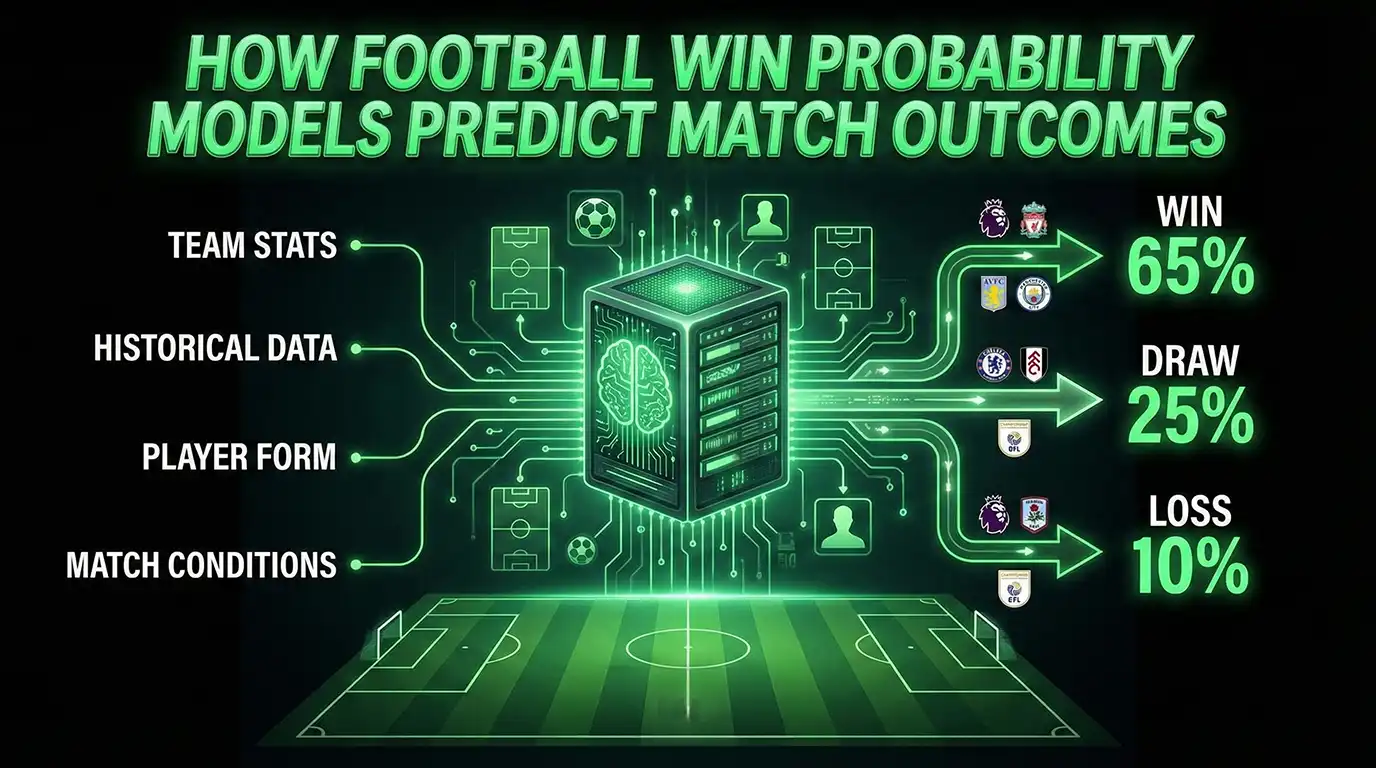
Think of win probability models as a super-powered analytical engine that processes team strength, recent form, historical performance, and countless other variables to generate accurate match forecasts. Instead of saying "Team A will beat Team B," these models might calculate "Team A has a 68% chance of winning, with a 19% chance of a draw and 13% chance of defeat."
This level of precision matters whether you're competing in Fantasy Premier League, participating in Last Man Standing pools, or simply wanting deeper insight into how matches unfold. Understanding football win probability models gives you a significant edge over gut feelings and media narratives.
How Win Probability Models Work: The Foundation
Modern football win probability models rely on advanced statistical techniques and machine learning algorithms. At their core, these models follow a systematic process:
Data Collection: Models ingest vast amounts of historical and current data, including match results, goals scored and conceded, shots on target, possession statistics, and player performance metrics. For Premier League and Championship analysis, this typically encompasses several seasons of data to establish reliable patterns.
Feature Engineering: Raw data transforms into meaningful predictors. Instead of just "goals scored," models might calculate "expected goals for and against," "recent form over five matches," "home advantage adjustment," and "strength of schedule metrics."
Model Training: Using machine learning algorithms like logistic regression, random forests, or neural networks, models learn which factors most strongly influence match outcomes. They identify patterns like "teams with strong expected goals differentials at home win 72% of matches against bottom-half opposition."
Technical Insight: Expected Goals (xG)
Most advanced win probability models incorporate expected goals data, which measures the quality of chances created and conceded. A team creating high-quality chances but failing to convert might see their win probability remain high because underlying performance suggests results will improve. This helps identify teams performing above or below their true level.
Probability Calculation: For each upcoming fixture, the model processes current team metrics through its trained algorithm to generate outcome probabilities. These aren't predictions—they're mathematical estimates based on what typically happens when teams with similar characteristics face each other.
Key Data Inputs That Drive Accurate Models
The accuracy of football win probability models depends entirely on data quality and relevance. Here are the critical inputs that power sophisticated models:
Team Strength Metrics: Models calculate offensive and defensive strength scores based on recent performance. A team scoring 2.1 expected goals per match with 0.8 xG against possesses different characteristics than one scoring 1.4 xG with 1.2 xG against. These metrics capture not just results, but underlying performance quality.
Current Form: Recent performance carries more weight than older results. Models typically analyse the last 5-10 matches, recognising that teams can improve or decline significantly during a campaign. A mid-table side on a strong unbeaten run might have higher win probabilities than their league position suggests.
Stat Pull-Out: Form Window Impact
Analysis of Premier League data shows that teams in the top quartile for expected goals difference over their previous eight matches win 62% of fixtures against mid-table opposition, compared to 48% for teams in the bottom quartile. This demonstrates why recent form significantly influences win probability calculations.
Fixture Context: Home advantage matters enormously in football. Historically, home teams win approximately 46% of Premier League matches compared to 31% for away sides, with draws accounting for the remaining 23%. Models adjust for this while recognising that某些 teams perform better at home or on the road.
Injury and Suspension Data: Player availability dramatically affects match probabilities. Losing a key striker, creative midfielder, or defensive leader can swing win probabilities by 5-10 percentage points. Advanced models track predicted lineups and factor in replacement quality.
Schedule Congestion: Teams playing European competitions or facing quick turnaround between matches may experience fatigue, affecting performance. Models consider rest days and travel when calculating probabilities.
Model Accuracy and Confidence Intervals
Understanding model accuracy requires distinguishing between individual match predictions and long-term performance. No model achieves perfect accuracy on every fixture—that's impossible in football's inherently uncertain environment. However, sophisticated models demonstrate remarkable reliability over large sample sizes.
When a model assigns a 70% win probability to a team, it doesn't guarantee victory. Instead, it means that if similar situations occurred 100 times, that team would win approximately 70 times. This is why understanding confidence intervals matters—you need to think probabilistically, not deterministically.
Technical Explanation: Calibration Curves
Model accuracy gets measured using calibration curves. When a well-calibrated model assigns 60% win probability across 100 matches, approximately 60 of those teams should win. Deviations from perfect calibration indicate either overconfidence (probabilities too extreme) or underconfidence (probabilities too conservative). The best models demonstrate strong calibration across probability ranges.
Advanced models achieve accuracy rates where teams assigned 70%+ win probability win approximately 70-75% of matches over full seasons. This represents significant improvement over basic prediction methods, though individual matches always contain uncertainty.
Why Models Outperform Gut Feelings and Media Predictions
Cognitive biases consistently lead humans to make poor probability judgements about football matches. Understanding these biases explains why mathematical models hold such advantage:
Recency Bias: Fans overreact to recent results, assuming one exceptional performance represents a new normal. Models objectively weigh form patterns without emotional overreaction to single matches.
Narrative Fallacy: Compelling stories around teams ("they've found their form under the new manager," "this player always scores in big matches") feel convincing but often lack statistical support. Models focus on data rather than narratives.
Availability Heuristic: We overestimate the likelihood of memorable events (like surprising upsets) while underestimating common outcomes. Models ground calculations in actual frequency data.
Stat Pull-Out: Model vs. Human Performance
Comparative analysis of expert predictions versus statistical models across Premier League seasons shows models achieving 5-8% better calibration on match outcome probabilities. While experts sometimes identify individual upset opportunities better, models prove more reliable across aggregate decision-making over full campaigns.
Overconfidence: Humans tend to be overly certain in their predictions, treating "likely" events as near-certain. Well-calibrated models express appropriate uncertainty, recognising that even 80% win probability means one in five matches produce unexpected results.
Sample Size Neglect: We draw strong conclusions from small samples (like three matches of form). Models require sufficient data points before inferring genuine changes in team strength.
How Outlast Labs Uses Win Probability Models
Outlast Labs leverages football win probability models to generate data-driven insights for Fantasy Premier League managers and survival pool participants. Our approach combines multiple modelling techniques with human expertise:
Ensemble Modelling: Rather than relying on single algorithms, we combine multiple models—each optimised for different prediction aspects—to generate more robust probability estimates. This reduces the risk of systematic errors from any single approach.
League-Specific Training: Our models train separately on Premier League and Championship data, recognising that playing styles, competitive balance, and scoring patterns differ between competitions. This ensures more accurate probability estimates for each context.
Real-Time Updates: As new match results become available, our models recalculate team strength metrics and win probabilities. This dynamic approach ensures probabilities reflect current reality rather than outdated assumptions.
Contextual Factors: Beyond pure statistics, we incorporate factors like predicted lineups, tactical matchups, and stylistic compatibility. This hybrid approach balances data-driven rigour with football intelligence.
Technical Insight: Fixture Difficulty Ratings
Our models translate win probabilities into intuitive fixture difficulty ratings, helping FPL managers and Last Man Standing participants quickly assess match difficulty. These ratings combine win probability, expected goals projections, and historical performance against similar opposition into clear difficulty tiers.
Probability Communication: We present probabilities clearly, explaining both the likelihood and uncertainty around each prediction. This helps users make informed decisions while understanding that football always contains inherent unpredictability.
Practical Examples: Premier League and Championship
Seeing how win probability models apply to real fixtures demonstrates their practical value. Consider these scenarios from recent campaigns:
Scenario 1: Mid-Table Fixture
Two mid-table Premier League teams face off—Team A sits 10th with moderate positive expected goals difference, Team B sits 12th with slightly negative xG difference. Team A plays at home, where they've been solid but not dominant. A basic prediction might call this "too close to call," but a win probability model calculates specific numbers: Team A win probability 44%, draw 28%, Team B win 28%. This reflects home advantage plus slight quality edge, while acknowledging high uncertainty.
Scenario 2: Title Challenger vs Relegation Battler
A top-four side with +1.2 expected goals difference hosts a relegation zone team with -0.8 xG difference. Intuition suggests the home side "should win easily," but models recognise football's upset potential. The calculation might show: home win 68%, draw 20%, away win 12%. This clearly favourites the superior team but acknowledges a genuine one-in-eight chance of defeat—crucial information for survival pool selection.
Stat Pull-Out: Upset Frequency
Historical Premier League analysis shows that teams with 60-70% win probability still lose approximately 15-20% of matches. This isn't model failure—it's the inherent uncertainty of football. Understanding this variance prevents overreaction to single unexpected results and encourages long-term thinking.
Scenario 3: Championship Promotion Battle
Two promotion-chasing Championship sides meet. Both possess strong attacking metrics but differ defensively—Team A concedes 0.9 xG per match, Team B concedes 1.3 xG. With comparable form and home advantage for Team A, the model calculates: Team A win 52%, draw 26%, Team B win 22%. The slight edge reflects defensive superiority and home advantage, but tight probabilities acknowledge the competitiveness of the division.
Scenario 4: Fatigue Factor
A top-six side playing their third match in eight days after European competition faces a bottom-half team with a full week's rest. Fatigue models might reduce the top-six side's usual win probability from 62% to 55%, recognising that tired teams perform below their typical level. This contextual adjustment represents another advantage of sophisticated modelling.
Using Win Probability Models for Better Decisions
Whether you're managing Fantasy Premier League squads or competing in Last Man Standing pools, win probability models provide actionable intelligence:
FPL Team Selection: When choosing between players from different teams, compare fixture difficulty using win probability models. A midfielder facing a team with high concession probability might outperform a slightly better player facing a staunch defence.
Captain Choices: Win probabilities inform captaincy decisions. Your standout captain option facing a 25% win probability fixture might underperform compared to your second choice against a 70% win probability matchup.
Survival Pool Selections: In Last Man Standing, avoiding favourites with 85%+ win probability improves long-term survival. Save those elite options for difficult gameweeks, selecting teams with 65-75% win probability when available to preserve better options.
Transfer Strategy: Understanding upcoming fixture difficulty helps plan transfers. Players from teams with favourable upcoming fixtures (high cumulative win probability) represent good targets for bandwagon strategies.
Technical Insight: Value Identification
Advanced models identify value by comparing predicted performance against ownership or selection rates. If a team has 65% win probability but low selection rates due to recent poor results, their players might represent strong differential value—assuming the model correctly identifies improved underlying performance.
Limitations and Uncertainty in Modelling
Even the best football win probability models face inherent limitations. Acknowledging these constraints ensures appropriate usage:
Squad Incompleteness: Until confirmed lineups emerge, models estimate player availability. Late injuries or unexpected tactical shifts can significantly alter match dynamics after probabilities are calculated.
Tactical Evolution: Teams can fundamentally change approach under new management or in response to specific opponents. Models trained on historical data may initially miss these tactical revolutions.
Random Variance: Football contains inherent randomness—a lucky deflection, red card decision, or moment of individual brilliance can overturn probability. Models express likelihoods, not certainties.
Sample Size Constraints: Early season predictions rely on limited data, increasing uncertainty. Model confidence typically grows as each campaign progresses and form establishes.
Frequently Asked Questions
What's the difference between win probability and expected goals?
Expected goals measure chance quality in individual matches or over time, while win probability models incorporate multiple factors including expected goals data to calculate match outcome likelihood. Think of expected goals as one important input into comprehensive win probability models.
How accurate are football win probability models?
Sophisticated models achieve good calibration over large samples—teams assigned 70% win probability win approximately 70-75% of matches over full seasons. However, individual matches always contain significant uncertainty, which models reflect through their probability estimates rather than definitive predictions.
Can win probability models guarantee profitable decisions?
No model guarantees success in every decision because football contains inherent randomness. However, consistently following probability-based decisions typically outperforms emotional choices over long time horizons. Think of models as providing a statistical edge, not certainties.
Why do models sometimes get it wrong on specific matches?
Models express probabilities, not certainties. When a 70% favourite loses, that's expected to happen approximately 30% of the time—the model isn't wrong, the less likely outcome simply occurred. Over many matches, these probabilistic predictions prove reliable.
How often are win probability models updated?
Quality models update continuously as new data becomes available—after each matchday, with injury news, and when new tactical information emerges. This ensures probabilities reflect current reality rather than outdated assumptions.
Do win probability models work differently for Premier League vs Championship?
Yes, different leagues require separate model training because playing styles, competitive balance, and scoring patterns vary. Championship matches typically see more goals and greater volatility than Premier League fixtures, affecting probability calculations.
Should I always pick the team with highest win probability in survival pools?
Not necessarily. Strategic considerations like option preservation and differentiation matter. Sometimes selecting a 65% win probability team makes more sense than using an 85% favourite you'll want for a difficult future gameweek.
Ready to make data-driven decisions? Explore our guide to Last Man Standing pool strategy or learn how pool size affects your approach. For weekly win probability insights and fixture difficulty ratings, try Outlast Labs free.